Strategy Testing in MetaTrader 4
I am sure anyone who is reading this document knows MetaTrader has a feature which allows you to back test your strategies. This is called the Strategy Tester, it can be accessed via the view menu or by the keyboard shortcut CTRL+R. Below is a screenshot showing the Strategy Tester interface:

This article is focused on improving the reliability of this tool. It does not however go into any detail about optimization. Firstly we will run a back test using a simple Expert Advisor with the standard default settings in MetaTrader the data centre being used is the InterBankFX data server. We will then import Alpari data and compare the results.
Standard Data
For the first test we set up with the Currency to be tested the AUD/USD. The period we use is daily and the model we use is every tick (based on all available least timeframes with fractal interpolation of every tick). The time period we will be testing is from
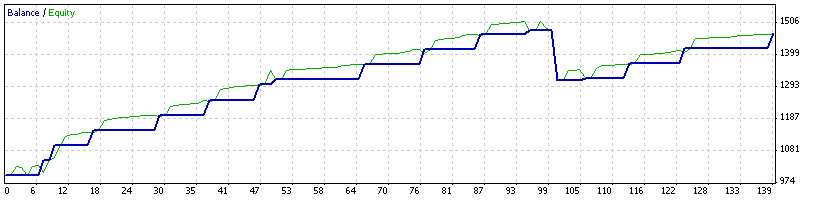
Strategy Tester Report MACD Sample
Bars in test | 559 | Ticks modelled | 4263759 | Modelling quality | 42.15% |
Initial deposit | 1000.00 | ||||
Total net profit | 470.00 | Gross profit | 635.00 | Gross loss | -165.00 |
Profit factor | 3.85 | Expected payoff | 26.11 | ||
Absolute drawdown | 0.00 | Maximal drawdown (%) | 165.00 (11.1%) | ||
Total trades | 18 | Short positions (won %) | 12 (100.00%) | Long positions (won %) | 6 (83.33%) |
Profit trades (% of total) | 17 (94.44%) | Loss trades (% of total) | 1 (5.56%) | ||
Largest | profit trade | 50.00 | loss trade | -165.00 | |
Average | profit trade | 37.35 | loss trade | -165.00 | |
Maximum | consecutive wins (profit in money) | 13 (481.00) | consecutive losses (loss in money) | 1 (-165.00) | |
Maximal | consecutive profit (count of wins) | 481.00 (13) | consecutive loss (count of losses) | -165.00 (1) | |
Average | consecutive wins | 9 | consecutive losses | 1 | |
Improving Modeling Quality
As we can see from our test the modeling quality was 42.15%. I for one would want to have a much better modeling quality then 42.15%. The one minute data we have from our demo feed has several gaps in it for one reason or another. These gaps reduce the quality of our modeling as the strategy tester will interpolate the areas between these gaps which may or may not trigger invalid buy or sell signals.
Gap filling (the free way)
If you want to improve modeling quality without spending vast sums of money you have come to the right place. A great free source of 1minute data for MetaTrader is alpari’s databank. Most currencies are available as well as Gold and various CFD’s.
Step By Step Setup Guide
Step One
The first step is to download the 1M currency data for the desired currency pair. You can access this data at http://www.alpari-idc.com/en/dc/databank.php. Or via the direct links below:
These files will be in a zip format. The first thing you will need to do is un-zip the file. You should now have a .hst file.
We now need to prepare MetaTrader for this new data. We change the default max bars in history, in order for our modeling to be more reliable. To do this we go to the tools menu then options or use the keyboard shortcut CTRL+O. The following toolbox should popup:

Now we are ready to import our data. To do this we go to History Centre. This is in the tools menu or can be accessed via the keyboard shortcut F2, the History Centre screen will pop up as shown below:

Now we have our data imported we need to open it as an offline chart. To do this we go to the file menu and click open offline. This will open a new window click on the one minute timeframe for the currency and then click open. This will then open a new chart as shown below.
 Step Five
The next step is to convert the period using period converter script. To do this with the offline chart shown above, Double click on the period converter script. This will bring up a new window like the one shown below:
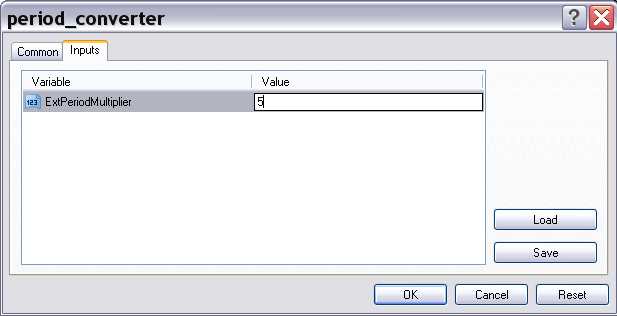
You need to click the inputs tab shown above and then in the values field insert the number of minutes you wish to convert the data to, and then click Ok. Do this for the following values 5, 15, 30, 240 and 1440.
Note: There will be no visible change to chart window, however in the log file of the terminal window you can confirm that the records have been successfully written. When you run the period converter script for the second and subsequent times a dialog box will appear asking if you want to replace the current period converter script you need to click yes to convert the next timeframe, make sure the previous period converter script has already finished.
Step Six
Congratulations you got this far preferably without tearing your hair out. Now we have reached our final step testing our new data. We rerun Strategy Tester with our original settings (Make sure the recalculate textbox is highlighted or you will just be using old data). Now sit back with your beverage of choice as Strategy Tester go to work. Remember to always make sure the model you use is every tick (based on all available least timeframes with fractal interpolation of every tick).
Step Seven
Conclusions
As a point of comparison I ran strategy tester with exactly the same settings with Demo data as shown page 2 and the Alpri data shown on the following page. As you can see there is a 30% increase in modeling quality with the Alpri data, this is still only 72.4% modeling quality. This of course is not optimal however it is better then the alternative. In dollar terms using the Alpari data a historical profit of USD$385 was recorded. In contrast using the demo data a profit of USD$470 was recorded. This may seem like a small amount however if the tests were extended to longer timeframes it would be much more significant. A final note back testing is better then no testing however it should be used with caution even with 99.999% model quality and a profitable EA it is no guarantee that your strategy will perform well LIVE. It is always a good idea to forward test with a mini account.
Strategy Tester Report MACD Sample (Alpari)
Bars in test | 511 | Ticks modelled | 994306 | Modelling quality | 72.41% |
Initial deposit | 1000.00 | ||||
Total net profit | 387.00 | Gross profit | 583.00 | Gross loss | -196.00 |
Profit factor | 2.97 | Expected payoff | 21.50 | ||
Absolute drawdown | 0.00 | Maximal drawdown (%) | 196.00 (13.5%) | ||
Total trades | 18 | Short positions (won %) | 10 (100.00%) | Long positions (won %) | 8 (87.50%) |
Profit trades (% of total) | 17 (94.44%) | Loss trades (% of total) | 1 (5.56%) | ||
Largest | profit trade | 50.00 | loss trade | -196.00 | |
Average | profit trade | 34.29 | loss trade | -196.00 | |
Maximum | consecutive wins (profit in money) | 13 (452.00) | consecutive losses (loss in money) | 1 (-196.00) | |
Maximal | consecutive profit (count of wins) | 452.00 (13) | consecutive loss (count of losses) | -196.00 (1) | |
Average | consecutive wins | 9 | consecutive losses | 1 | |

Disclaimer: Forex trading is risky. The high degree of volatility within the Forex market largely within the intraday market, coupled with ability to leverage your positions means that losses can be greater then your initial investment. This article is for educational purposes only and does not constitute financial advice.


No comments:
Post a Comment